Debugging
Debugging is twice as hard as writing the code in the first place. Therefore, if you write the code as cleverly as possible, you are, by definition, not smart enough to debug it.
(Brian Kernighan)
If you need help with general debugging topics, read: How do I Debug my Program? ⧉ For more in-depth explanations regarding debugging in MPS, visit:
- Debugging in MPS ⧉ (Specific Languages' blog)
- White paper on Debugging in MPS ⧉ (DSLFoundry's blog)
- Debugging MPS with IntelliJ setup
The following list shows some debugging tips:
- The menu entry Tools → Internal Actions provides many useful debugging features, for example, the UI Inspector (Swing debugging).
- Right-click → Preview Generated Text: Show the result of the M2T transformation (for example, generated code) for the current node
- To inspect the node, right-click → Show Node in Explorer
- To open the inspector, right-click → Inspect Node
- Right-click in the editor and select Language Debug:
- Show Type: Show the type system type of the current node.
- Rule which caused Error: Find the checking rule/constraint which caused the error.
- Cell in Explorer: Debug editor cells and collections.
- Generation Traceback: Debug the generator. In transient models, you can find the generated (intermediate) node's source node.
- Find Action: Help → Find Action or Ctrl+Shift+A if you forgot the name of your action.
- Changing IDE settings
- 2 locations: bin folder (MPS/IDE folder) and preferences folder (overwrites bin folder)
- JVM: bin/mps.vmoptions (RAM/Xmx, debugger port, …)
- Log-level (Log4J): bin/log.xml
- IDEA properties: bin/idea.properties: change default paths, advanced IDE settings
- Log file: is stored in the logs folder, for example,
Logs/<My-MPS-/My-RCP-Identifier>/idea.log
How do I debug action maps?
Set a breakpoint in CellActionExecutorFinder ⧉.
Free Java Debugging Tools
Since MPS is a Java application, you can use standard Java debugging tools. Not all of them work well. Tools that pause threads can also cause issues with MPS. Especially VisualVM tends to freeze MPS. A better profiler is YourKit ⧉ which is a commercial product.
-
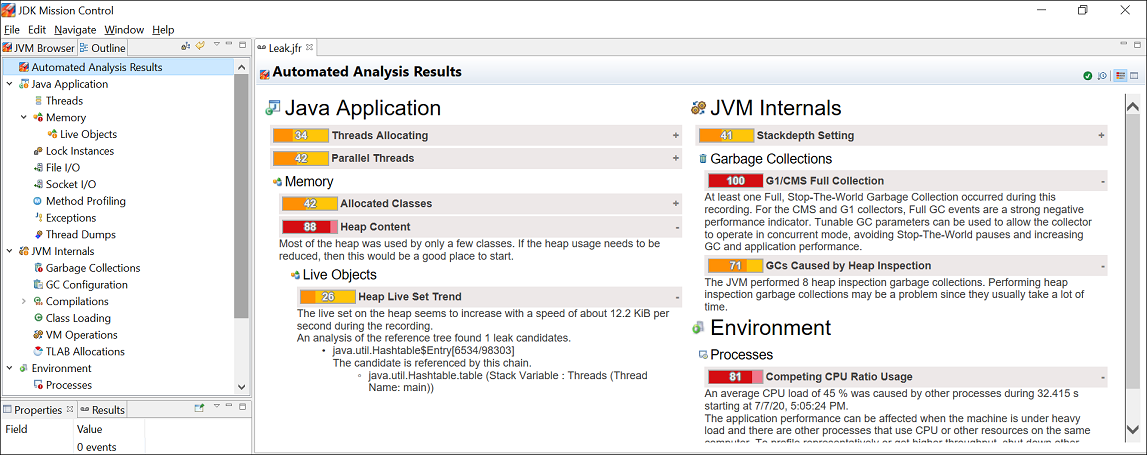
- display process configuration and environment (e.g., Java/MPS version, JVM arguments, system properties)
- monitor process performance and memory (e.g., CPU/heap usage, loaded classes, threads)
- visualize process threads (e.g., dispatch thread)
- profile performance and memory usage (e.g., CPU usage)
- take and display thread dumps (e.g., find deadlocks ⧉)
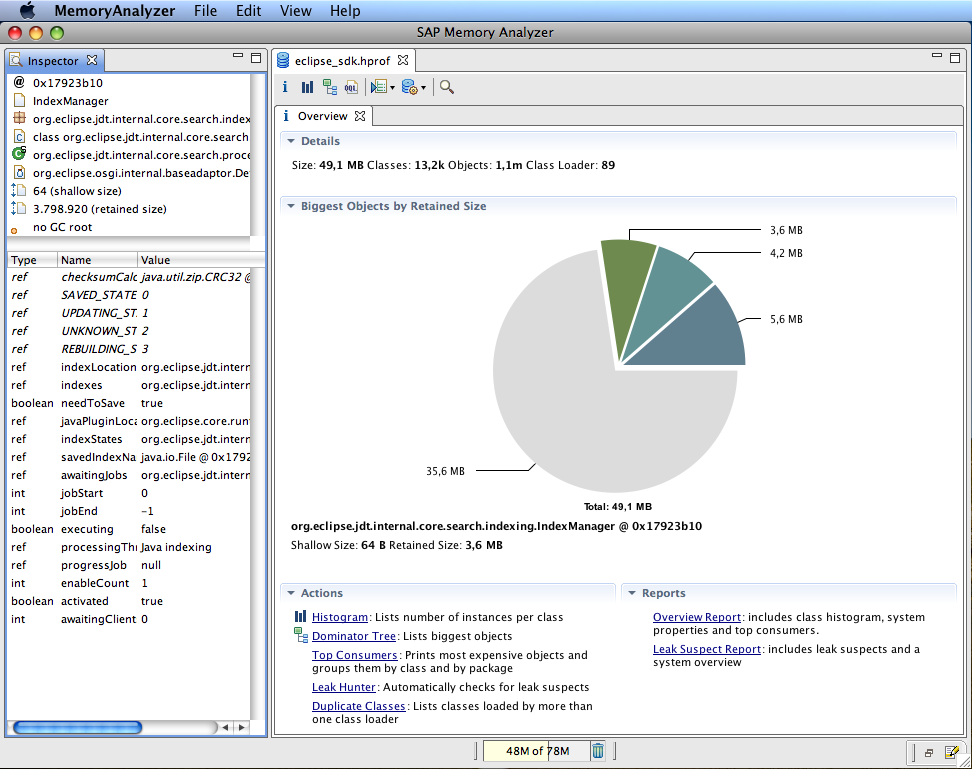
- take and browse heap dumps (e.g., find memory leaks)
- analyze core dumps (e.g., crashed Java processes)
-
- find memory-related issues such as memory leaks
Decompiler
Decompiling jar files usually shouldn't be necessary because the source code of MPS, IntelliJ Community, JetBrainsRuntime ⧉, and the MPS platforms is open source and available on GitHub. For all other cases, use the JD Java Decompiler. The Java Decompiler IntelliJ plugin ⧉ also is capable of doing this task.
General Blog Posts
- 24 debugging tips and tricks ⧉
- The Debugger Checklist – Part I ⧉
- The Debugger Checklist – Part II ⧉
- Debugging tips ⧉
- 10 Debugging Tips for Beginners ⧉


