Profiling Embedded Code in mbeddr
Performance is an important concern in embedded software. As a consequence, it is important to make the developer of the performance implications of the code a developer writes. This is even more important if and when developers use higher-level abstractions to express the system's functionality, as mbeddr recommends.
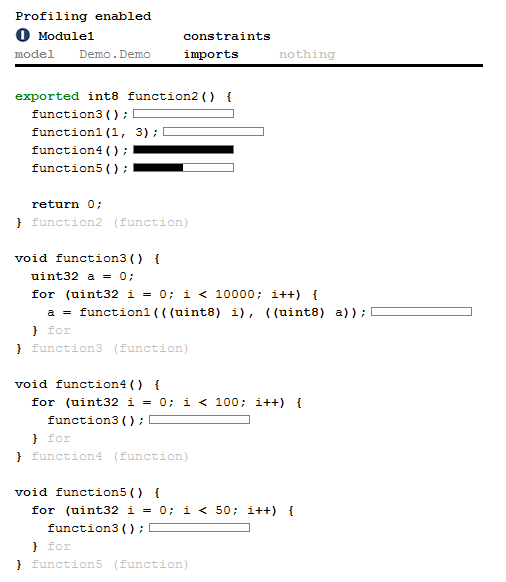
As part of his Bachelor's thesis, Janosch Jägers is currently building a profiling infrastructure for mbeddr. To profile a module, a developer can attach the Profiling annotation to the module. Running the program, the execution statistics are collected and displayed inline, as the following screenshot shows; the length of the bar shows the relative average timespan used to execute the respective function. Clicking on the bar reveals additional details in the inspector.
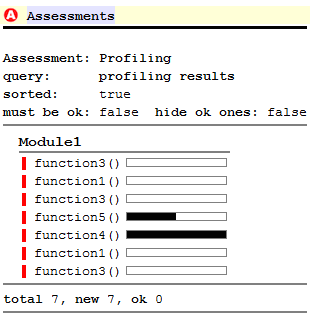
While embedding the bars in the code is useful to connect the results to the program, it is also useful for the developer to compare the various execution times. To achieve this, an assessment can be used. The following screenshot shows an example.
In terms of the implementation of the profiling infrastructure, the solution is portable: it uses no compiler-specific features. Since mbeddr generates the low-level C code in any case, the generator can simply be used to inject the profiling code. This generator functionality is of course modular in the sense that it does not invasively change the existing C generators: it is implemented as a model-to-model transformation that runs before the to-text generator.
The next step for the profiling infrastructure is to provide convenient facilities for profiling the language extensions available in mbeddr, and not just functions. Stay tuned.