Graph Visualizations in mbeddr/MPS
Wow, long time no blog. Sorry for that. Here's some news:
As an additional means of displaying relationships between nodes (next to PlantUML and the tree views) we have integrated the JUNG framework for graph display. As a language developer, you can implement an interface IJGraphProvider and implement a method that creates the graph:
- Programmable with high-level API
- Specify initial layout
- Configurable node size, color, line style and color, fill color, shape and label
- Configurable edge width, style, color and label
- Configurable tooltip text for nodes and edges
- Extensibility to plug in your own layouters (such as the one from yWorks)
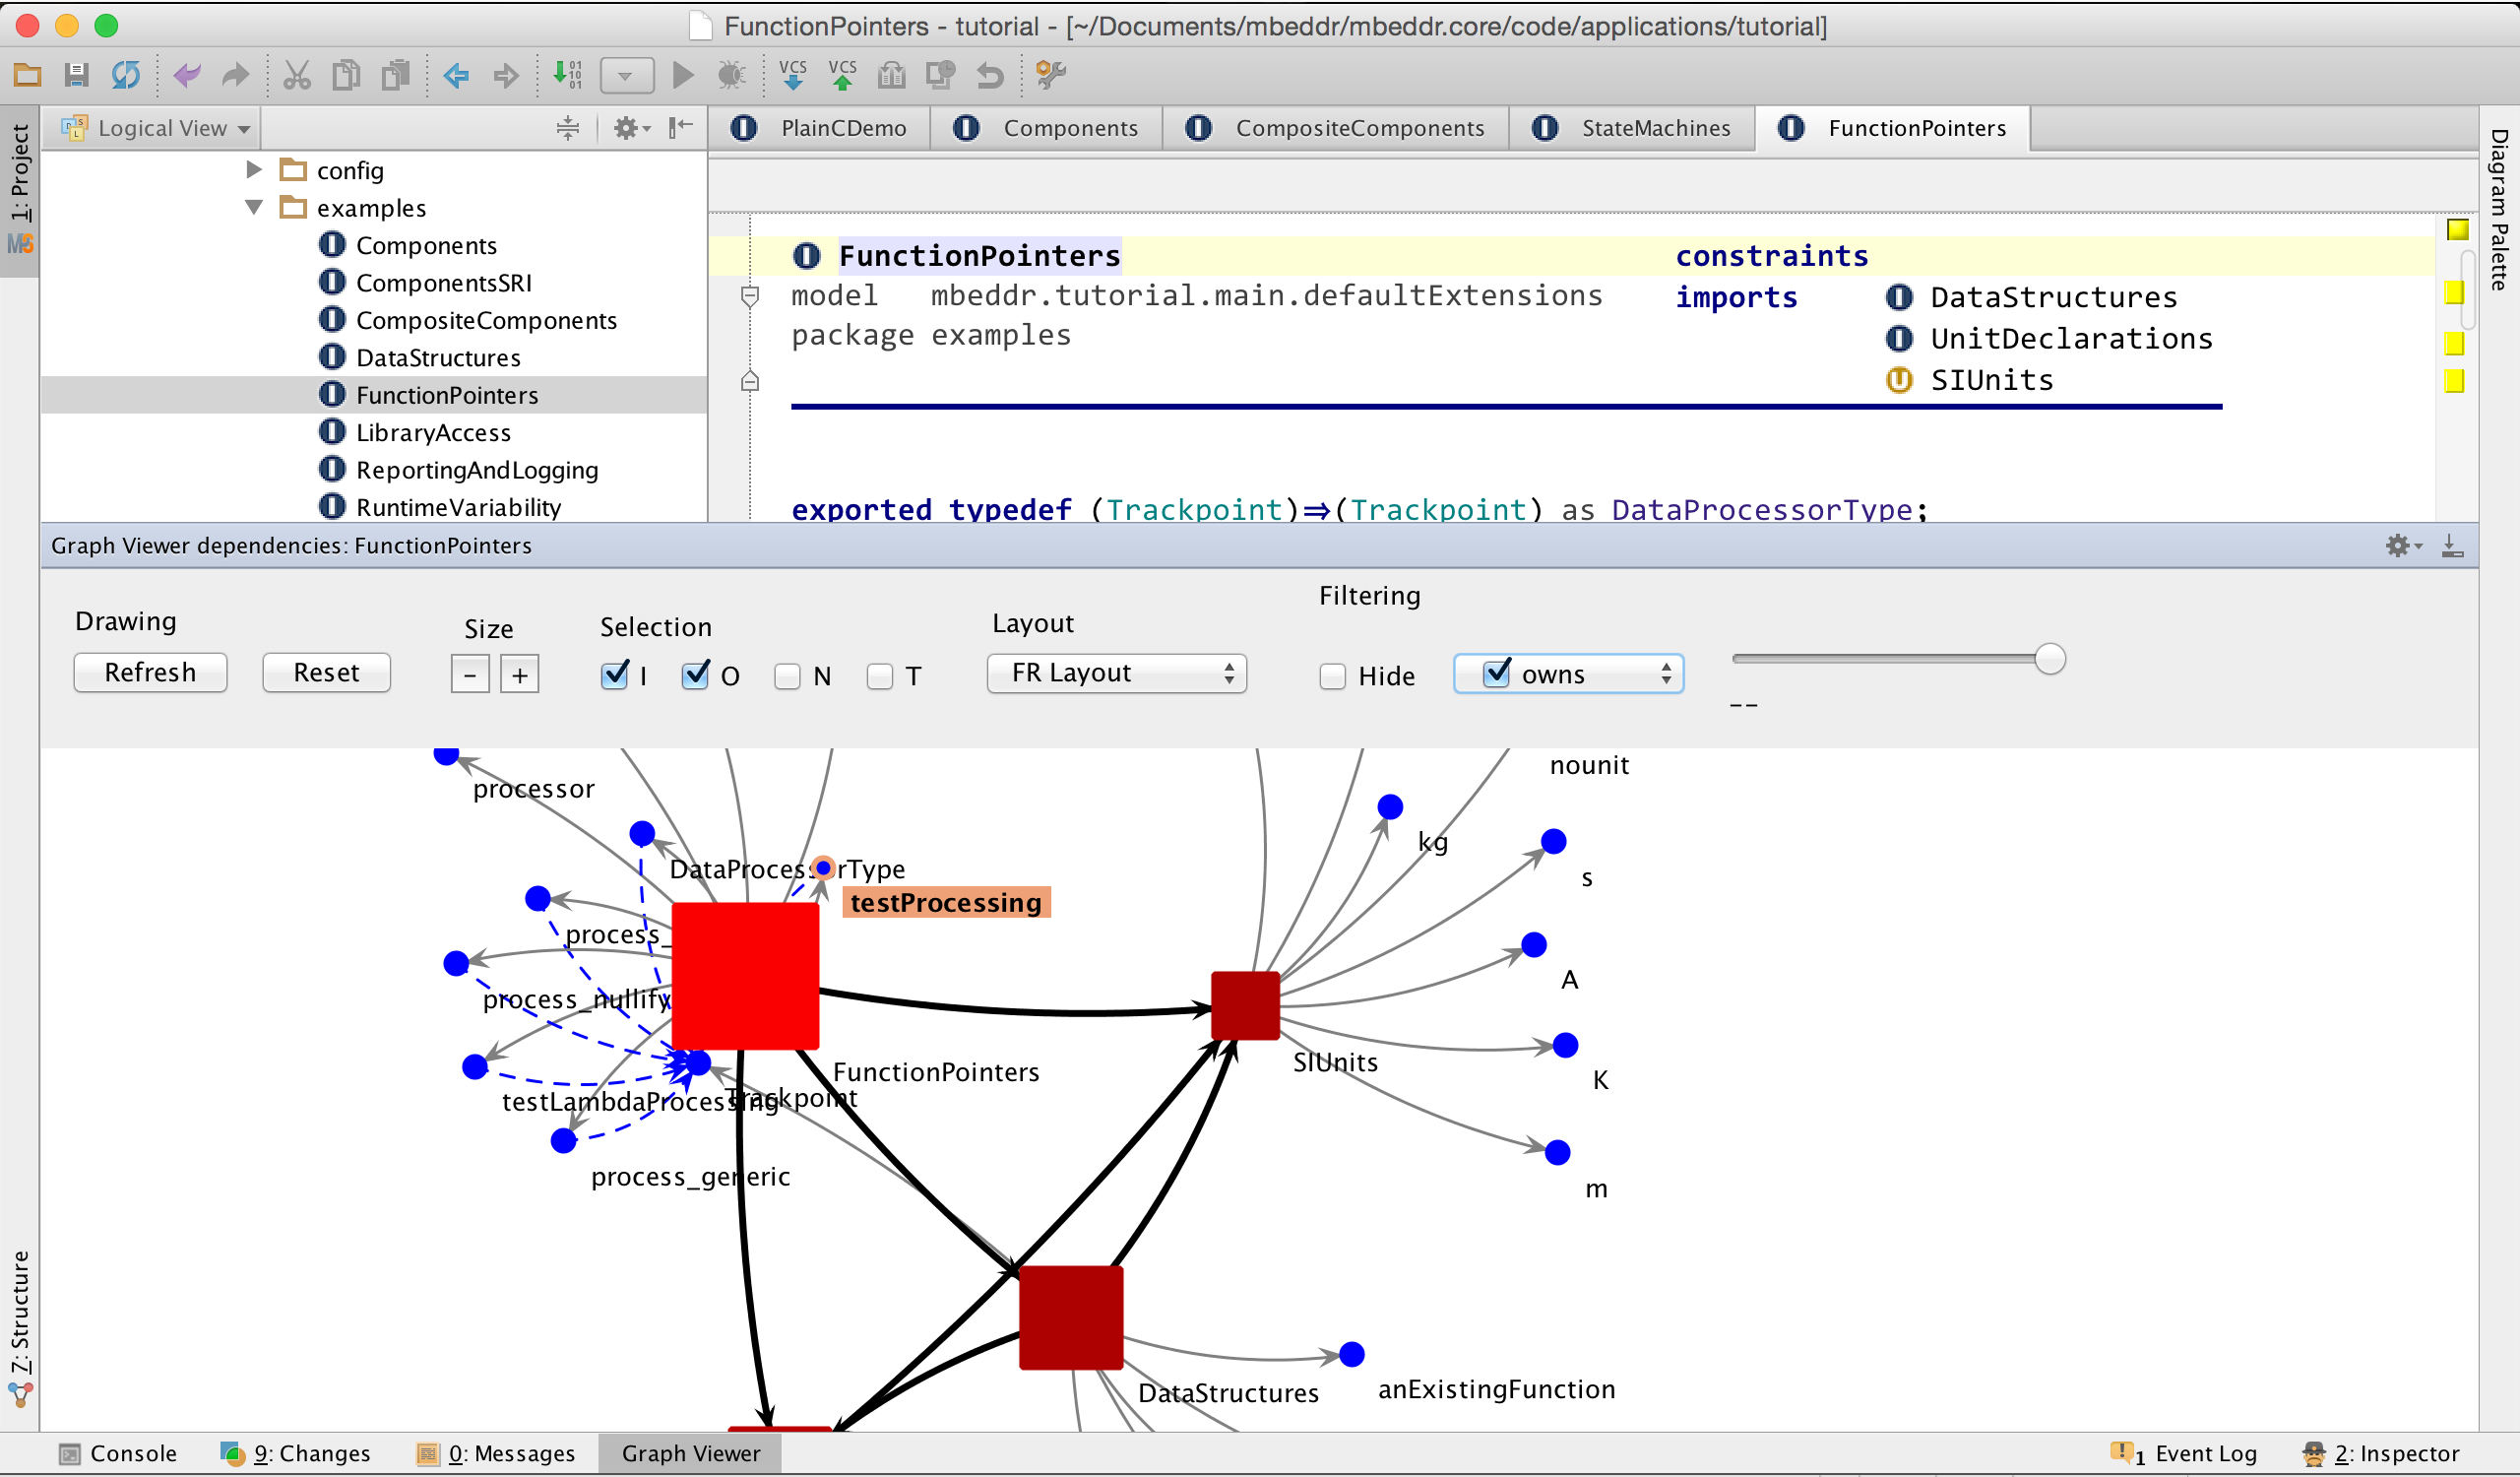
Once you have created a graph, your users have many options to view the graph in an MPS tool window:
- Double-click selects node or edge in editor
- Zoom and Pan
- Tooltips
- Selectable Layouts
- Selection and highlighting of outgoing and incoming nodes and edges
- Filtering based on node and edge type
- Filtering along a continuous axis (for example, time)
- Incremental, node-based collapsing and expansion
The JUNG integration is available as part of mbeddr, but also as part of the mbeddr.platform, so you can use it for your own languages. Check out the Chunk node for an example of how to use it.