Debugging Problems¶ ⧉
Different kinds of problems can occur in MPS. Some of them are bugs that you have to fix. Other issues might be unfixable or caused by an unusual approach to tackling a problem (e.g., accessing a project instance from unsupported places). For debugging purposes, you can add log statements to the code, execute tests, analyze stack traces, run code on the MSP console, or use remote debugging ⧉.
Deal With Errors
Error messages come in all forms and sizes and can appear in different places. While some error messages can be ignored because users can't face them easily, for example, class loading issues when reloading modules, most error messages shouldn't be ignored. As a developers, the most import part is navigating to the code which causes the error through the UI or a stack trace. In the worst cast scenario, you must find the text of the error message in the sources of the offending project, to figure out what's going on.
Errors in the Editor
Those errors (red squiggly lines) are caused by checking rules ⧉ or type system rules. Right-click the offending cell in the editor → Language Debug → Go to Rule Which Caused Error to navigate to the statement that causes the error. When calculating a type fails, the type system trace ⧉ can be helpful. The same debug menu also contains a Show Type entry showing the computed type. Most of the time, using this action and understanding the type system check is more straightforward than using the tracing tool.
IDE Fatal Errors
You can find fatal errors by clicking on the error icon in the bottom right corner of the window.
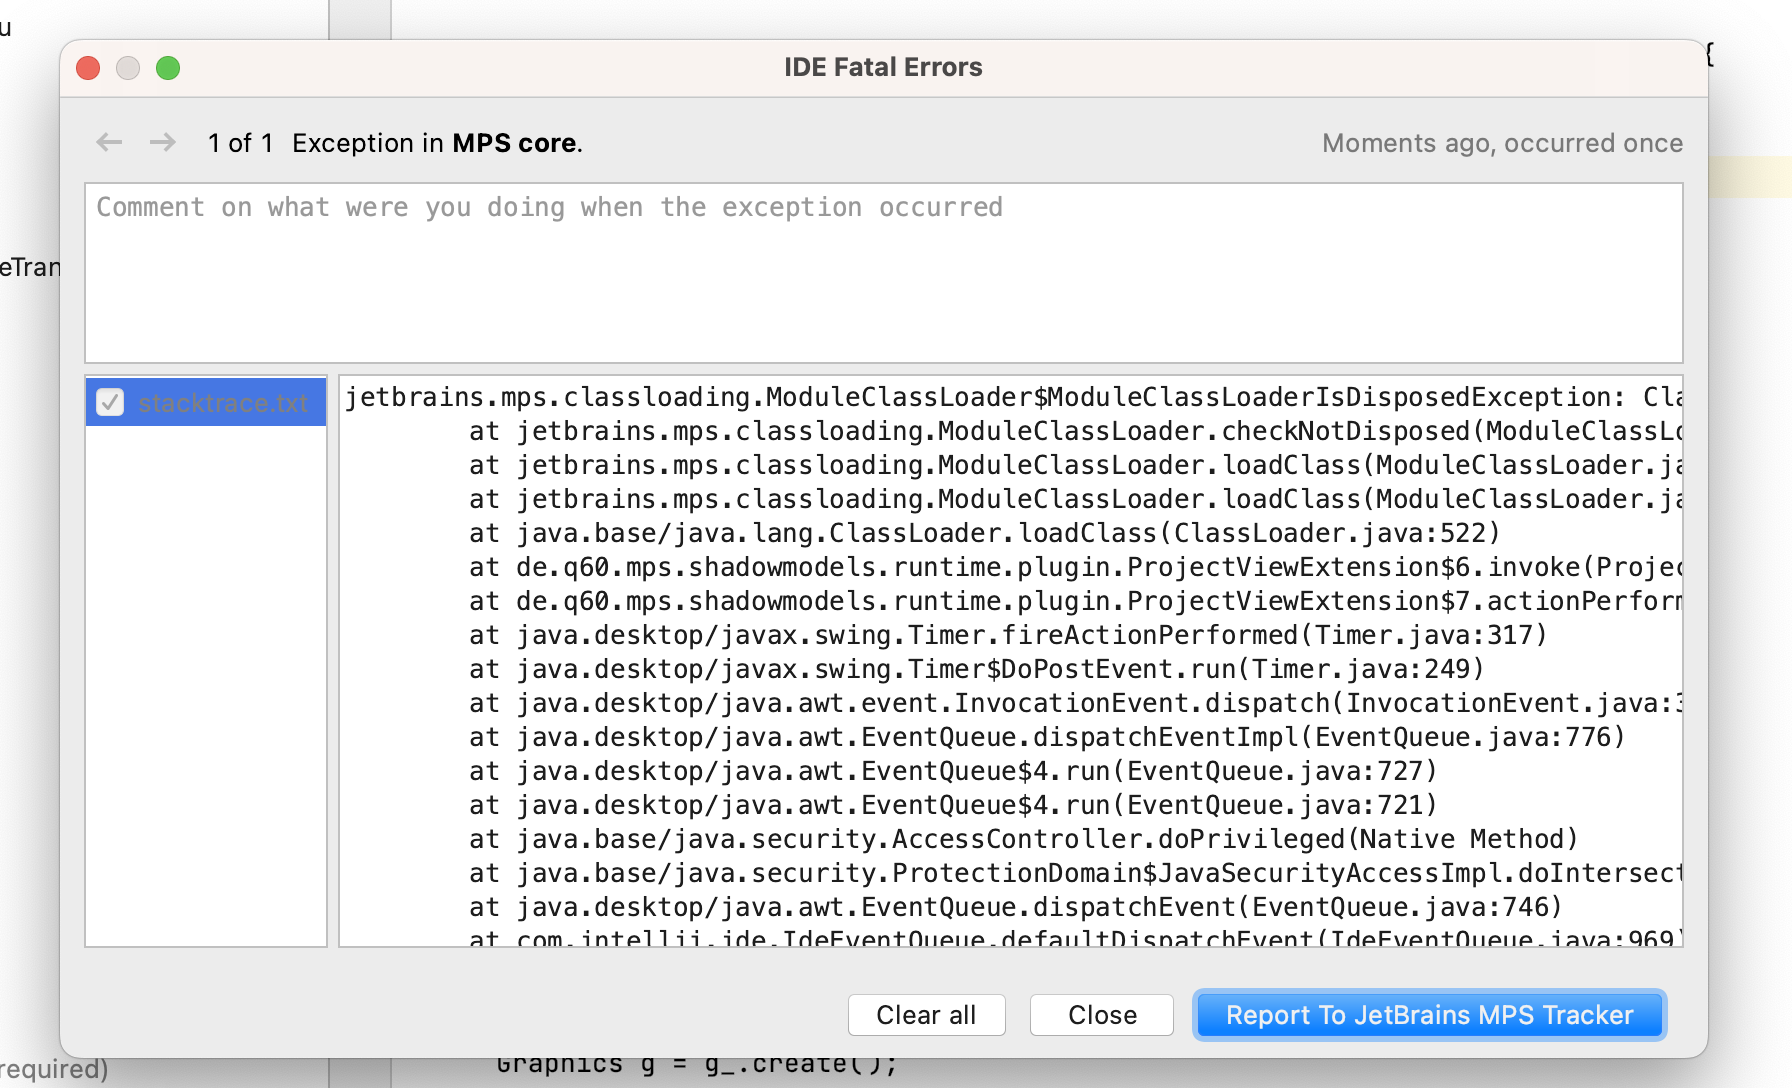
This dialog contains exceptions your language, MPS platforms, or MPS itself might cause. In the provided example, the source of the error is deceptive: the plugin that contains the exception is MPS core, but looking at the package name, we see that the exception comes from Shadow Models ⧉. If you need help determining where an error comes from, look at the page issue trackers. Only report the error to the JetBrains MPS Tracker if MPS causes the exception. To analyze the exception, open the error dialog and copy the message. Then click in the main menu on Analyze → Analyze Stack Trace and press ok. The run window will display the stack trace. It also provides links to the corresponding sources for lines where it is available.
Errors in the Log File¶ ⧉
Log statements, MPS platforms, MPS, and the IntelliJ platform can write error messages to this file. You can fix many exceptions quickly if they don't come from your languages, but sometimes they can still contain valuable hints. Example: When the startup's automatic module maker fails, only the error tooltip shows only the number of errors and warnings. The error log contains the exact stack trace. This file also saves messages about unloadable models.
The Editor Can’t Be Rendered

When the editor can't create an editor cell, the stack trace can be analyzed by clicking on Stacktrace. Editor-related exceptions can have more severe consequences than other exceptions like fatal errors: in the worst-case scenario, you can't open the editor, or MPS freezes completely. When this happens, locate the MPS module that causes the freeze in your local file explorer, delete the _gen folders so that MPS can't load the module, and restart. Now the module is not active anymore, and you can start debugging. The same approach works for application and project plugins that crash the MPS instance. If your language does not cause the exception, please report the issue to the language's developer.
Dealing With Wrong Outputs
Wrong outputs can occur in many places:
- A Base Language method calculates an incorrect value.
- An intention creates an incorrectly initialized node.
- A checking rule shows null instead of the expected message.
- A generator generates the wrong output.
The list goes on. Most of those cases can be checked automatically with the testing languages. The quick navigation table ⧉ provides information on how to test certain language aspects.
There are generator tests for generators, but they are often not fine-grained enough because you usually want to partly compare models and ignore specific children, properties, or references. An alternative approach is to invoke the generator yourself ⧉ and compare the structure of the input and output model with your asserts. If the command line doesn't run the tests, it is possible to show differences between nodes graphically through:
The language com.mbeddr.mpsutil.comparator can help compare nodes programmatically while ignoring some children, properties, or references.